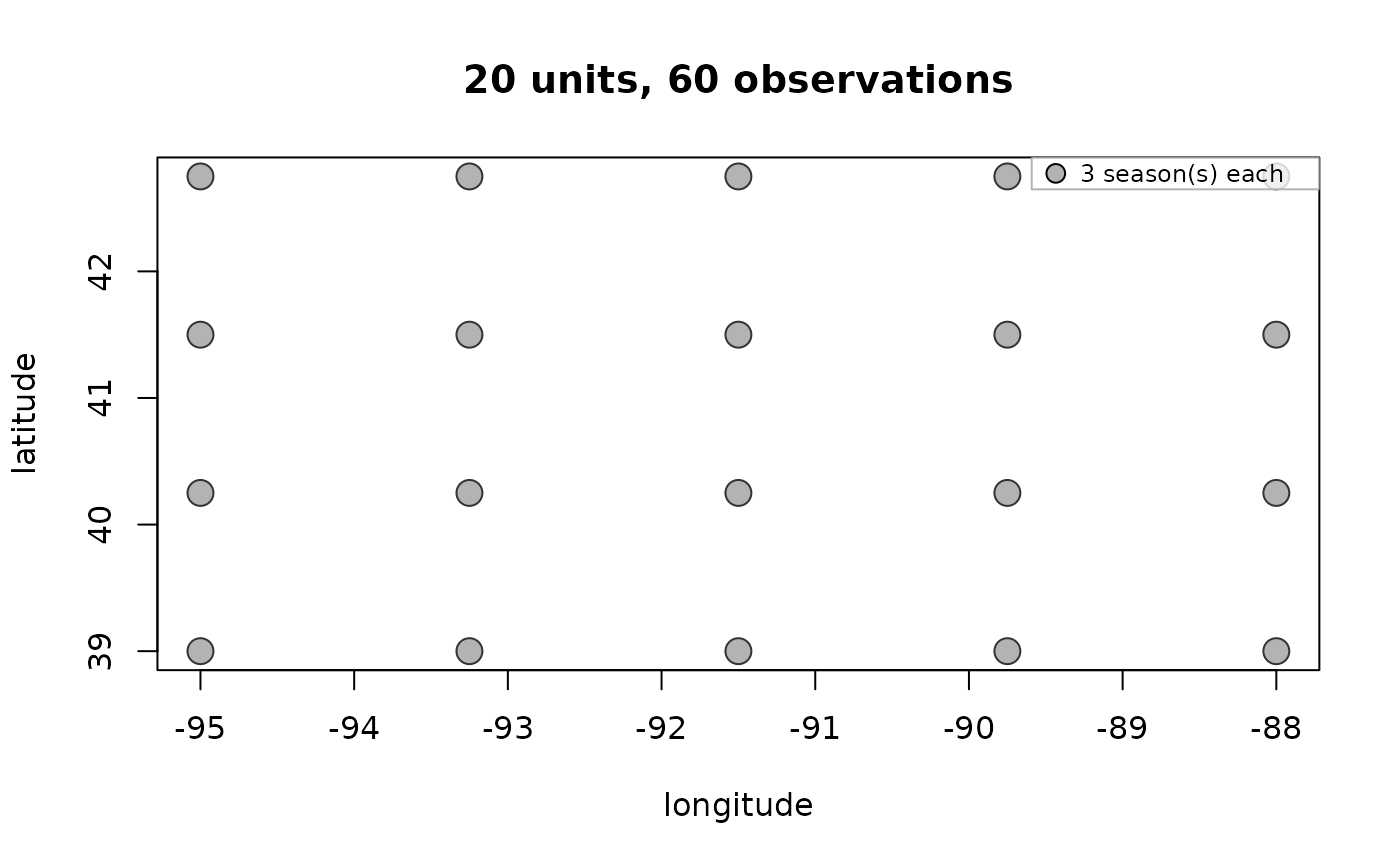
Draws the units in space, sized by how many seasons each was observed in. Worth looking at before modelling: clustered units are the situation that makes random cross-validation misleading, and it is easier to see than to infer.
Usage
# S3 method for class 'agri_project'
plot(x, ...)
Arguments
- x
An
agri_project().- ...
Passed to
plot.
Examples
p <- agri_project(demo_agri_data(n_units = 20, n_seasons = 3))
plot(p)