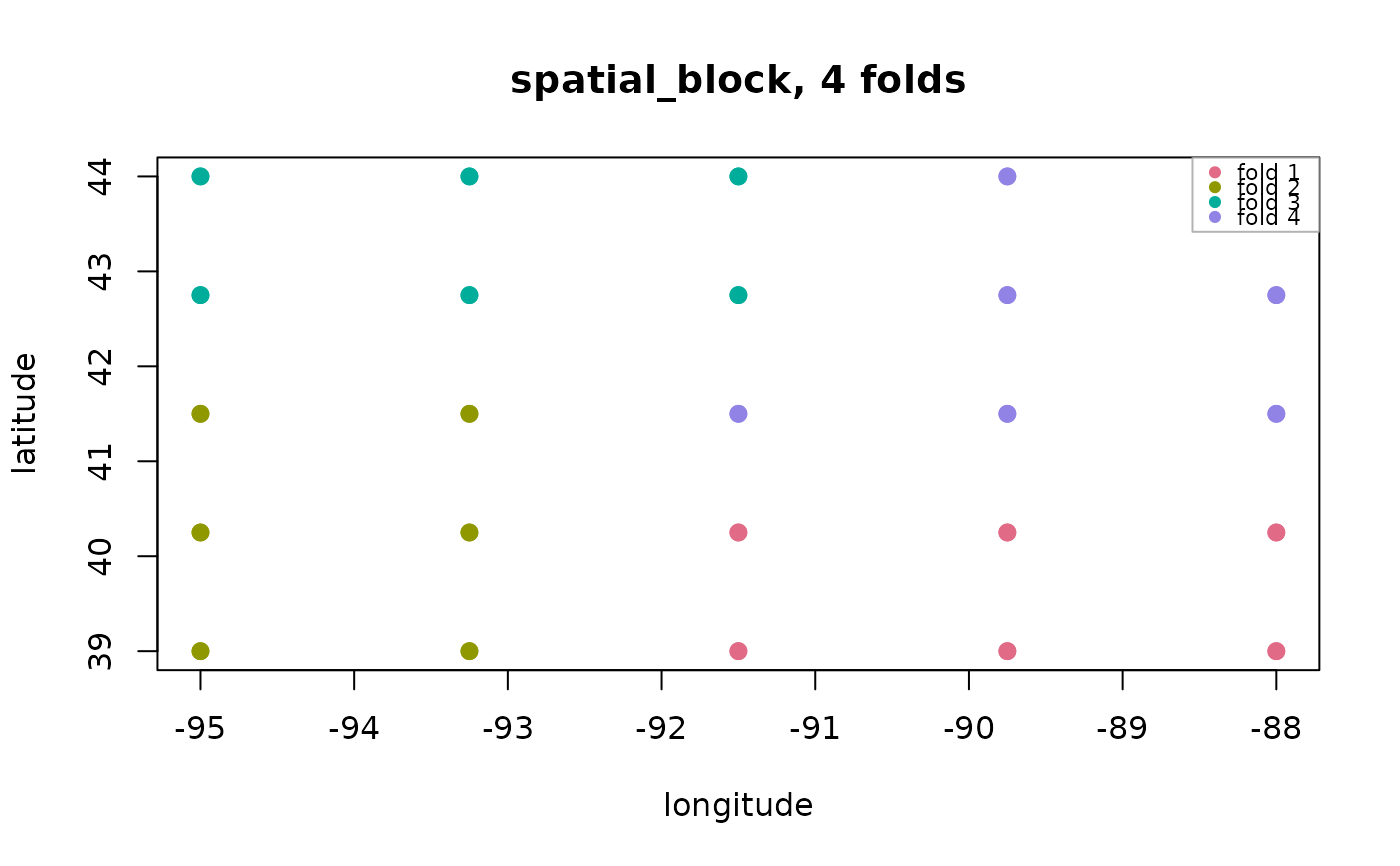
Draws each unit coloured by the fold it is held out in, so that what the blocking actually did can be seen rather than assumed. Blocks that look interleaved are not blocking anything.
Usage
# S3 method for class 'agri_resample'
plot(x, ...)
Arguments
- x
An
resample_scheme()object.- ...
Passed to
plot.
Examples
p <- agri_project(demo_agri_data(n_units = 24, n_seasons = 2))
p <- build_features(phenology_windows(add_climate(p)), stats = "sum")
plot(resample_scheme(p, method = "spatial_block", k = 4))