Plot a fitted model
Arguments
- x
A model fitted by
train_model().- type
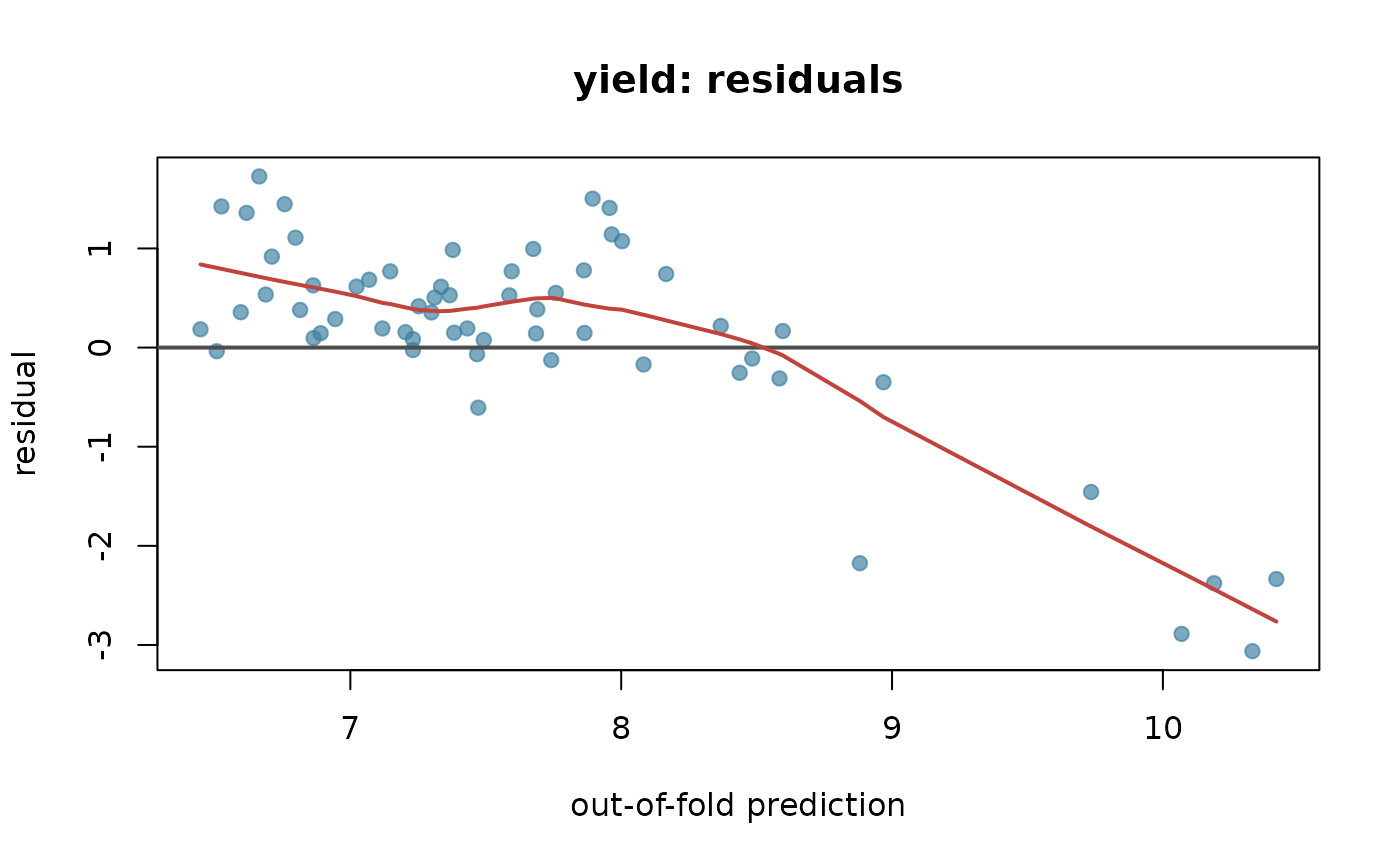
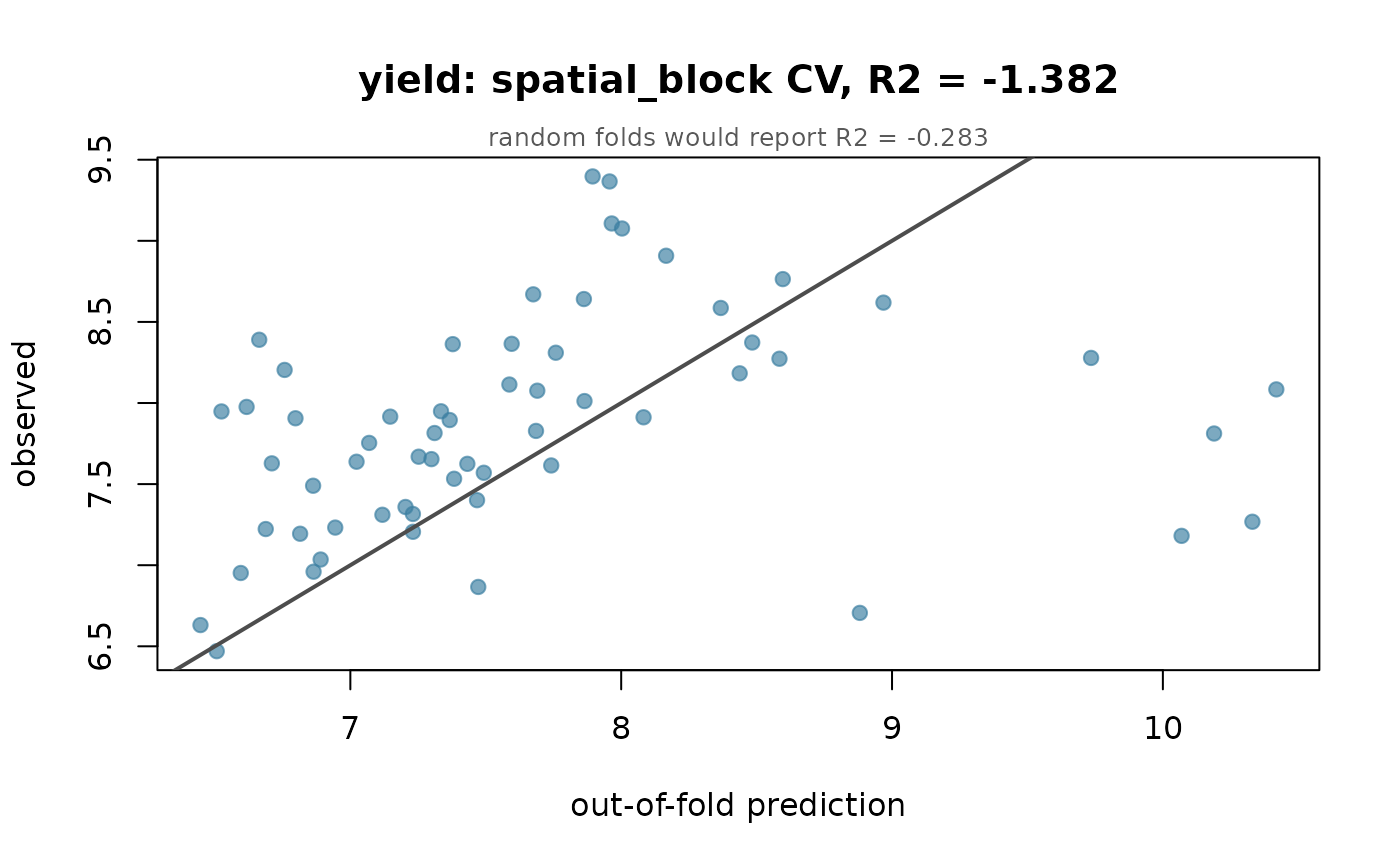
"observed"plots out-of-fold predictions against the truth with a one to one line, which is the honest version of the usual fitted-versus-observed figure;"residuals"plots residuals against the prediction, to expose bias that a single skill number hides;"importance"draws out-of-fold permutation importance.- top
Number of features for
"importance".- n_perm
Shuffles per feature for
"importance".- ...
Passed to
plot.
Examples
p <- agri_project(demo_agri_data(n_units = 20, n_seasons = 3))
p <- build_features(phenology_windows(add_climate(p)), stats = "sum")
m <- train_model(p, "yield", algorithm = "lm", k = 3)
plot(m)
 plot(m, type = "residuals")