Draws accumulated local effects, partial dependence, or individual conditional expectation curves for one feature.
Usage
plot_effect(model, feature, method = c("ale", "pdp", "ice"), grid = 20, ...)Arguments
- model
A model fitted by
train_model().- feature
Name of the feature to show.
- method
"ale","pdp"or"ice".- grid
Number of grid points.
- ...
Passed to
plot.
Details
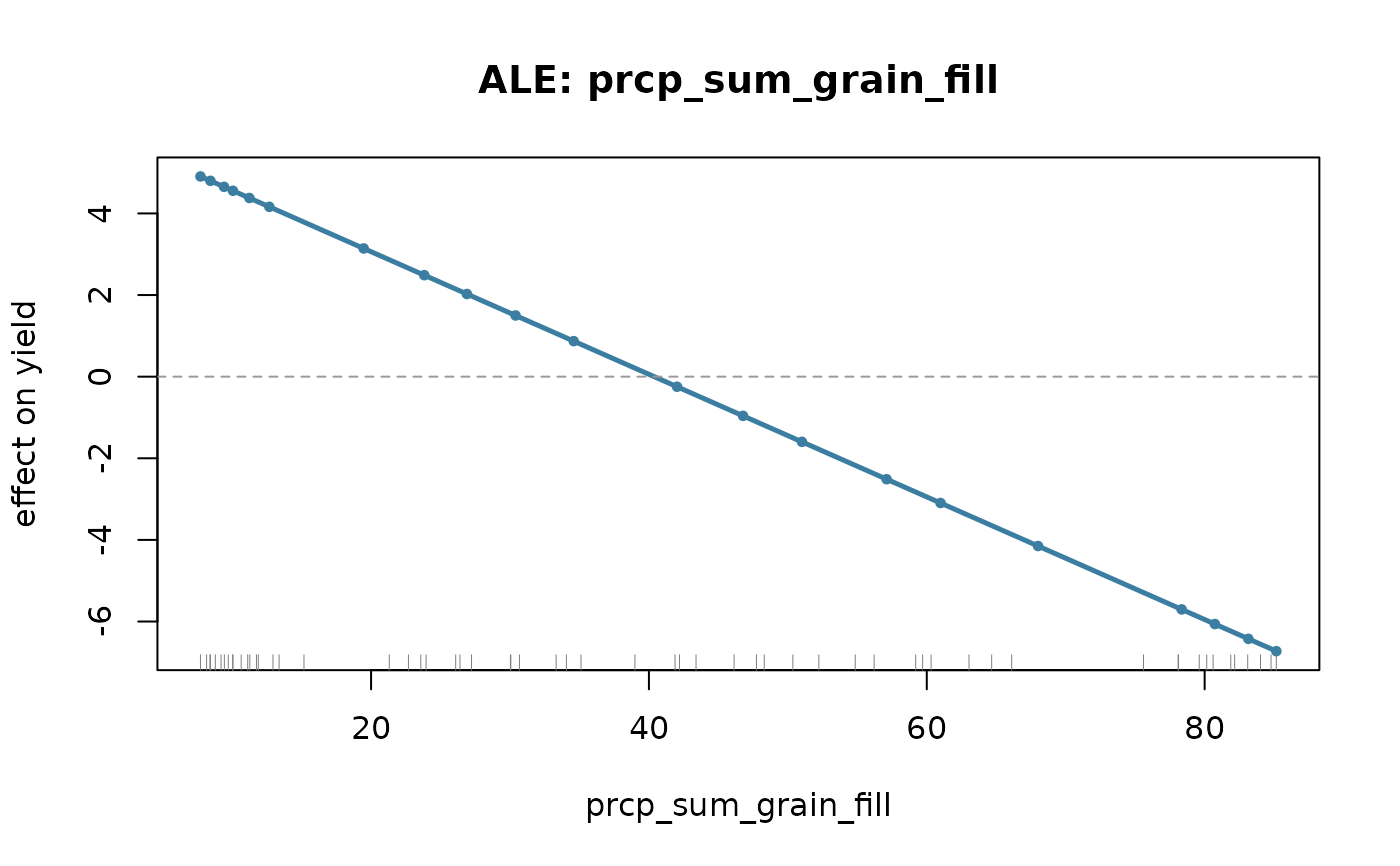
Accumulated local effects is the default deliberately. Partial dependence averages the model over feature combinations that may never occur, which for correlated weather features it routinely does; ALE accumulates local differences instead and does not.
Examples
p <- agri_project(demo_agri_data(n_units = 20, n_seasons = 3))
p <- build_features(phenology_windows(add_climate(p)), stats = "sum")
m <- train_model(p, "yield", algorithm = "lm", k = 3)
plot_effect(m, "prcp_sum_grain_fill")