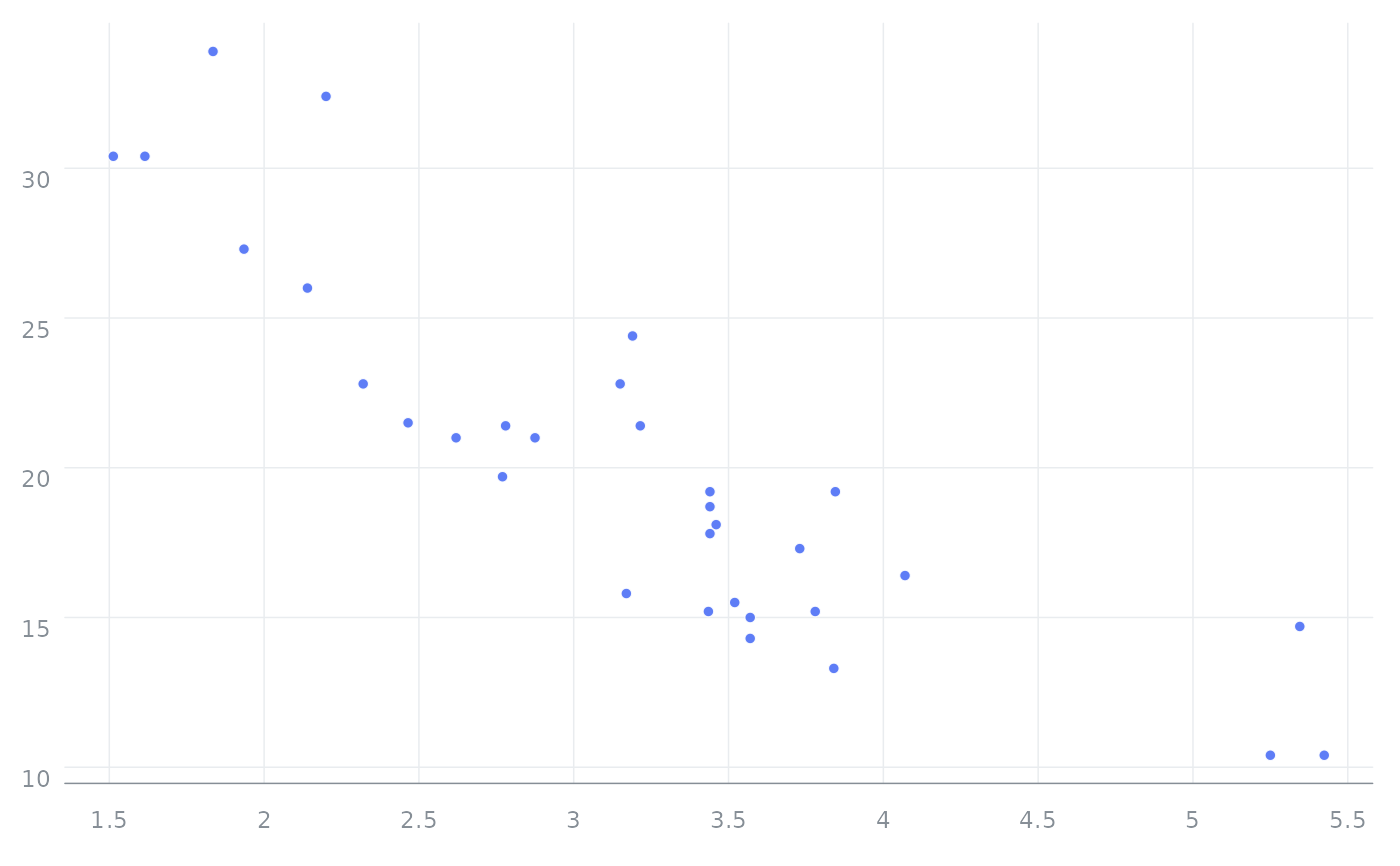
Themes control the non-data appearance of a plot: colours of the background,
grid, axes and text, plus base font size. Add a theme to a plot with +.
Usage
orb_theme_light(base_size = 12, ...)

orb_theme_dark(base_size = 12, ...)

orb_theme_minimal(base_size = 12, ...)

orb_theme_ink(base_size = 12, ...)Examples
p <- orb(mtcars, x = wt, y = mpg) + orb_points()
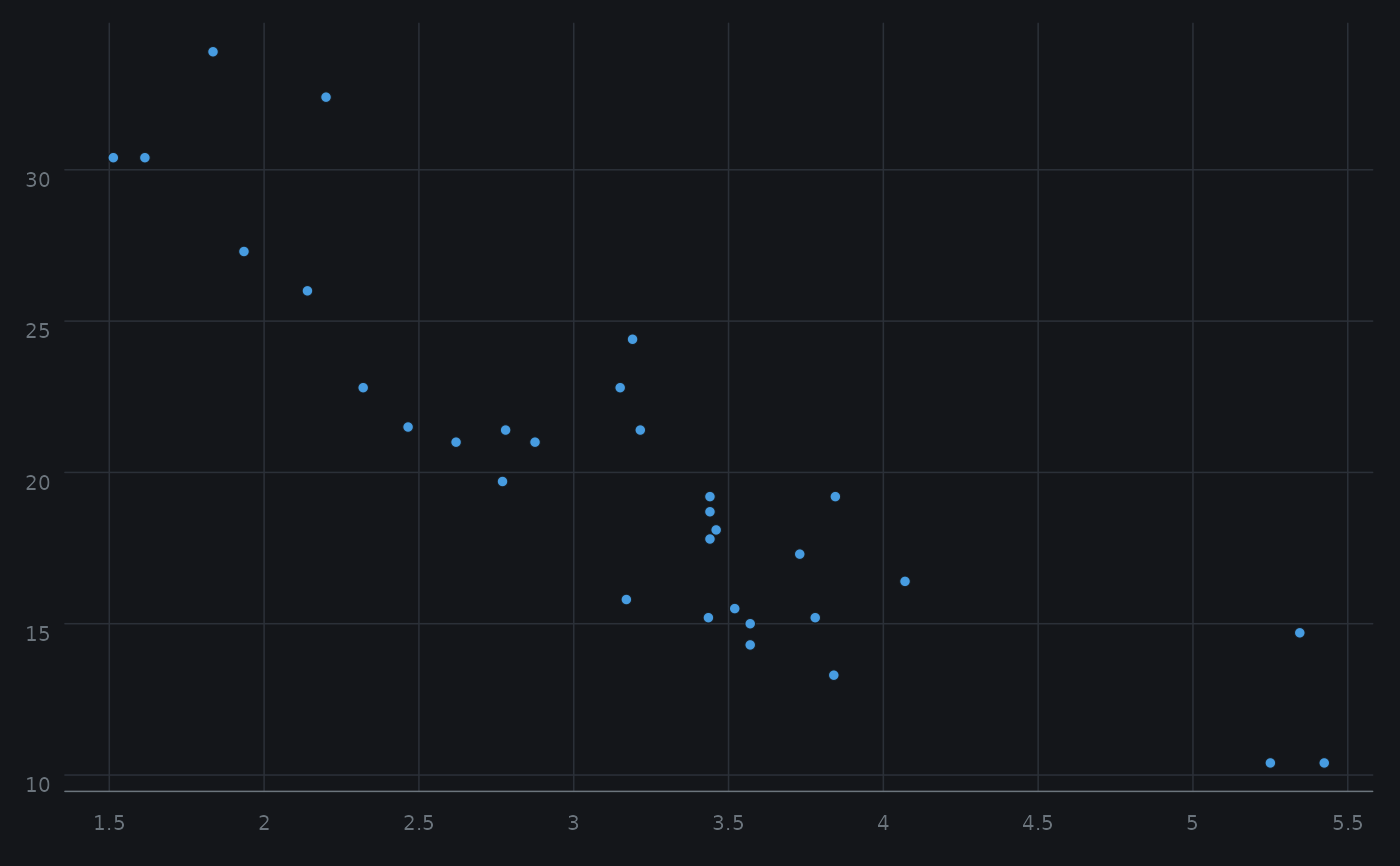
p + orb_theme_dark()
#> <orb_spec>
#> data: 32 rows x 11 columns
#> mapping: x, y
#> layers: points
 p + orb_theme_light(base_size = 14)
#> <orb_spec>
#> data: 32 rows x 11 columns
#> mapping: x, y
#> layers: points
p + orb_theme_light(base_size = 14)
#> <orb_spec>
#> data: 32 rows x 11 columns
#> mapping: x, y
#> layers: points