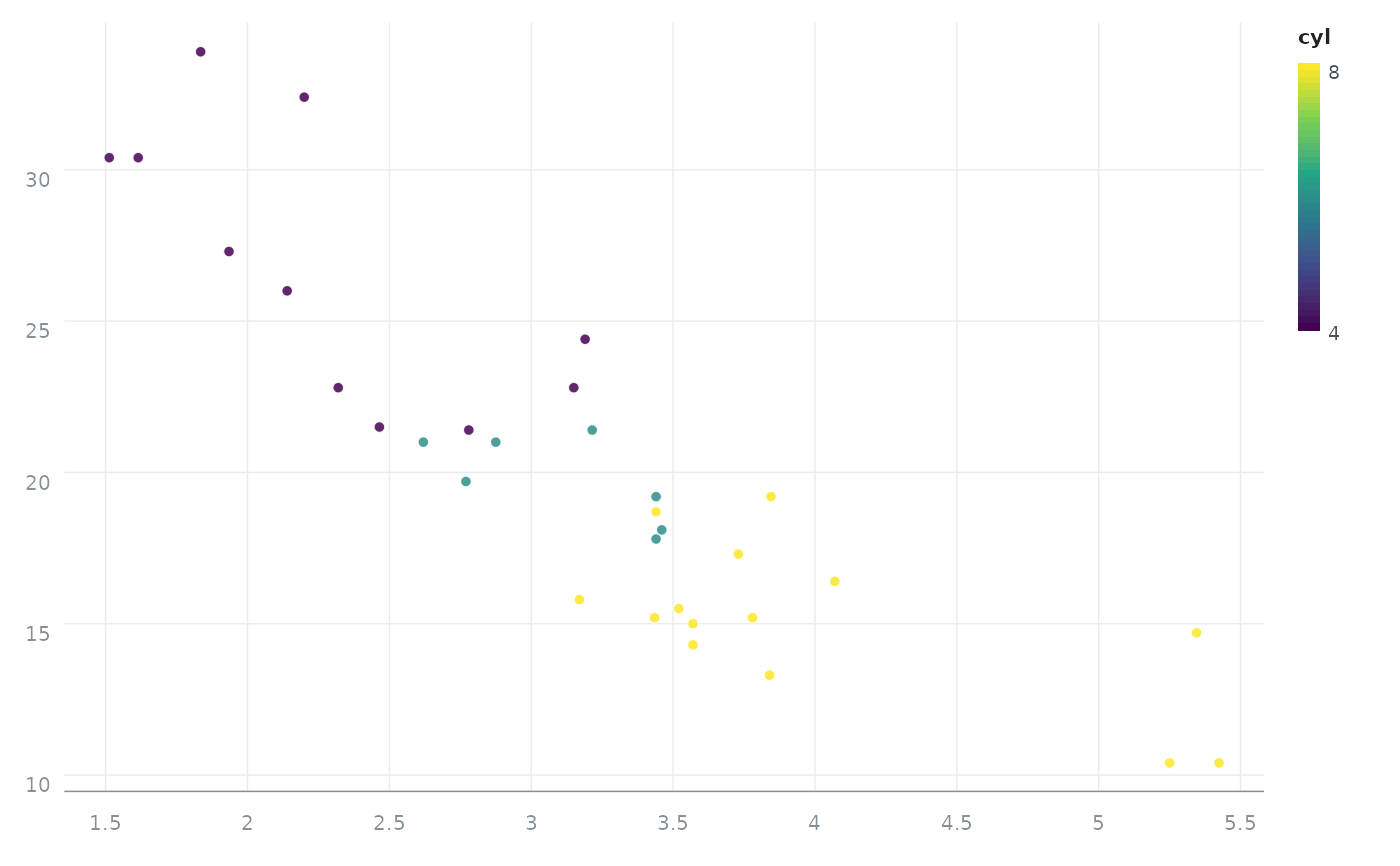
Draws one mark per observation: a scatter plot, or a bubble chart when a
size mapping is present.
Usage
orb_points(
  ...,
  data = NULL,
  size = 3.2,
  colour = NULL,
  fill = NULL,
  alpha = 0.9,
  stroke = 0.8
)
Arguments
- ...
Aesthetic mappings for this layer only, as
channel = column.- data
Optional data frame overriding the plot data.
- size
Point radius in pixels when
sizeis not mapped (default 3.2).- colour
Fixed colour used when the
colourchannel is not mapped.- fill
Fixed fill used when the
fillchannel is not mapped.- alpha
Opacity between 0 and 1.
- stroke
Outline width in pixels.
Examples
orb(mtcars, x = wt, y = mpg, colour = cyl) + orb_points(alpha = 0.85)
#> <orb_spec>
#>   data:   32 rows x 11 columns
#>   mapping: x, y, colour
#>   layers:  points