Plot-level options
Arguments
- legend
Should a legend be drawn when a colour, fill or size mapping is present? Default
TRUE.- grid
One of
"both","x","y"or"none".- interactive
Should the SVG output embed interactive behaviour (tooltips, hover highlighting, zoom, pan and legend toggling)? Default
TRUE. Raster output is unaffected.
Examples
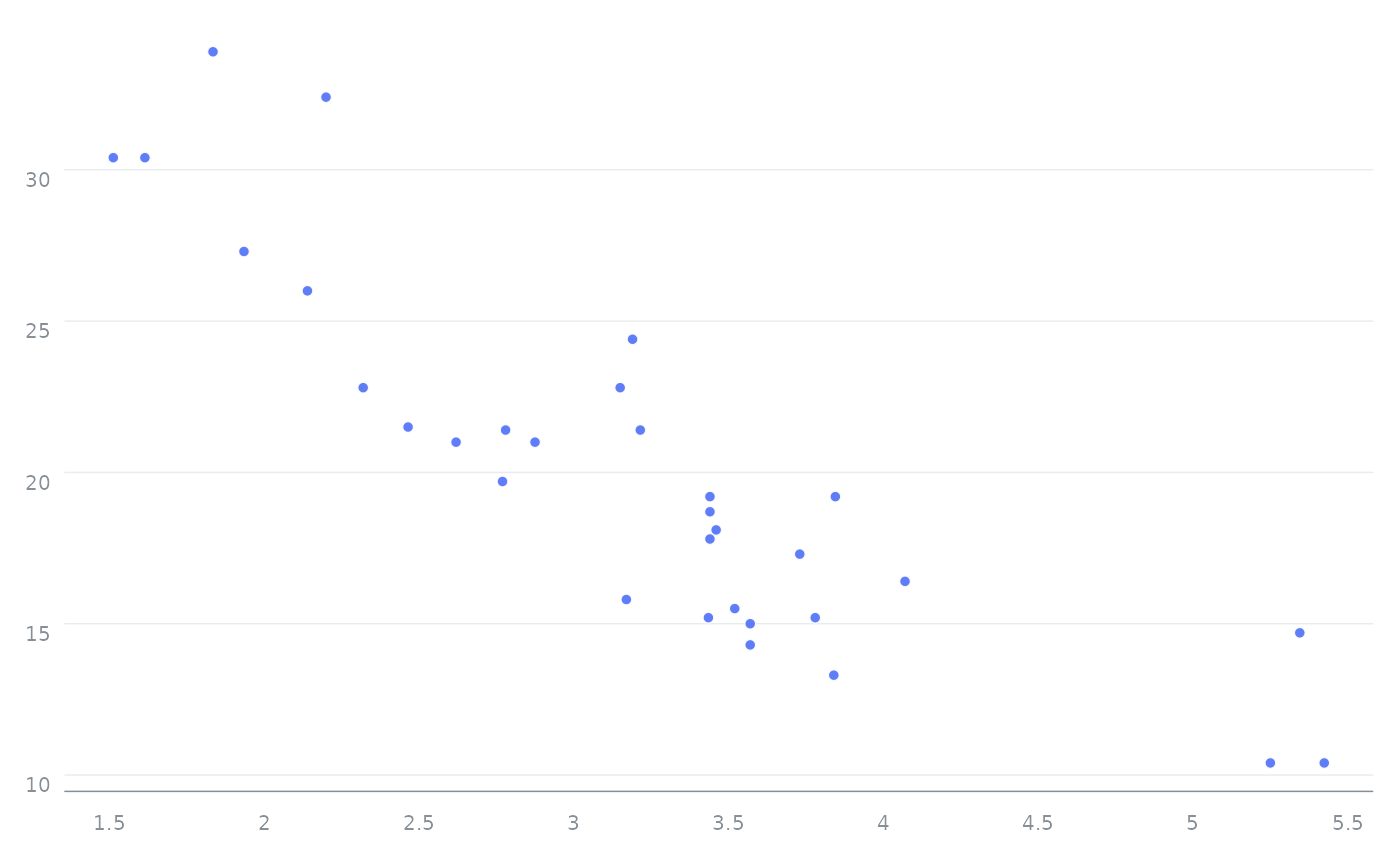
orb(mtcars, x = wt, y = mpg) + orb_points() + orb_options(grid = "y")
#> <orb_spec>
#>   data:   32 rows x 11 columns
#>   mapping: x, y
#>   layers:  points