Axis, legend and plot labels
Usage
orb_labs(
  title = NULL,
  subtitle = NULL,
  x = NULL,
  y = NULL,
  colour = NULL,
  fill = NULL,
  size = NULL,
  caption = NULL
)Examples
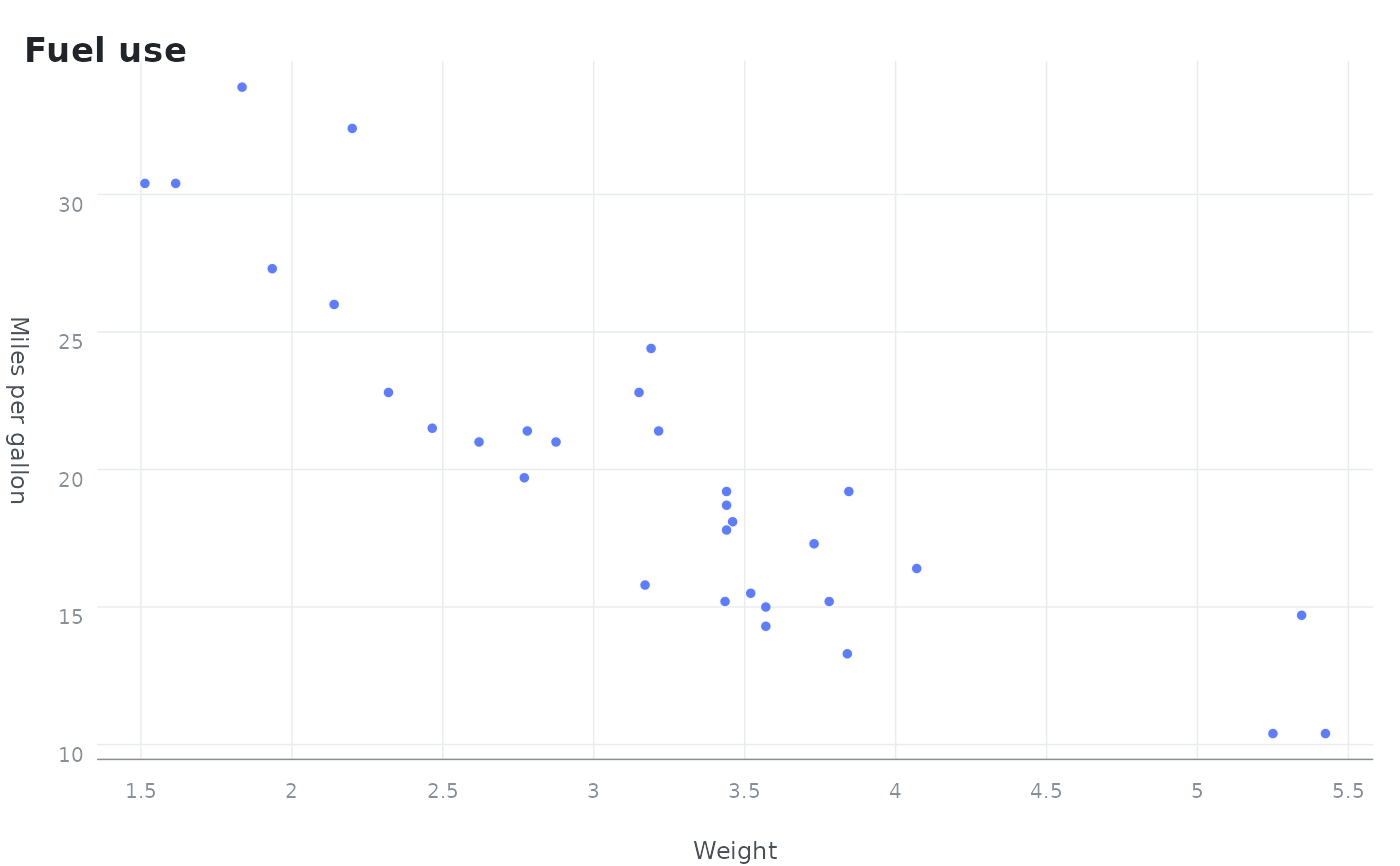
orb(mtcars, x = wt, y = mpg) + orb_points() +
  orb_labs(title = "Fuel use", x = "Weight", y = "Miles per gallon")
#> <orb_spec>
#>   data:   32 rows x 11 columns
#>   mapping: x, y
#>   layers:  points