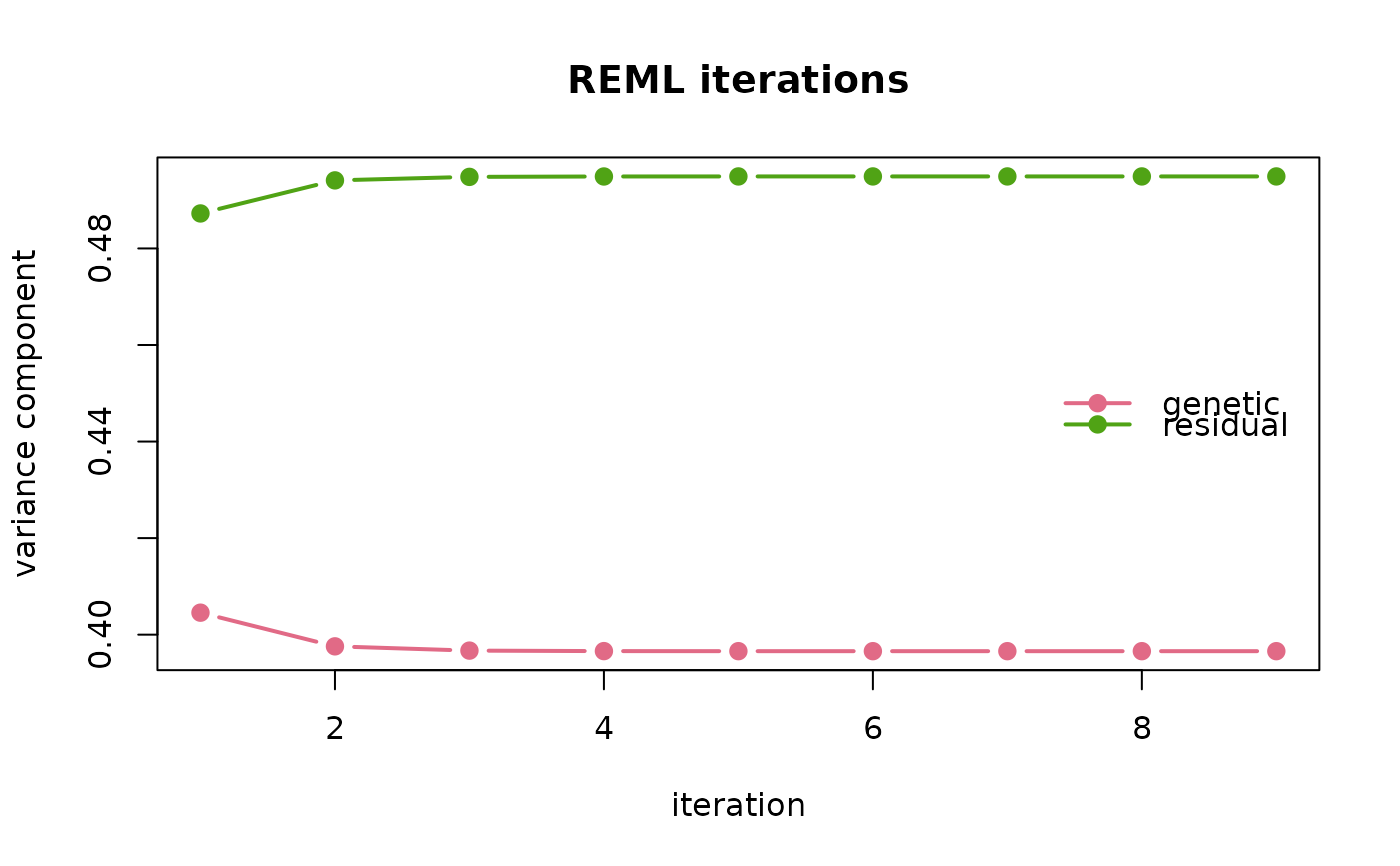
Draws the genetic and residual variance estimates at each iteration, which shows whether the fit settled or was still moving when it stopped.
Usage
# S3 method for class 'reml_sketch'
plot(x, ...)
Arguments
- x
An object from
reml_sketch()orreml_exact().- ...
Passed to
graphics::matplot().
Examples
set.seed(1)
dat <- sim_genomic(n = 200, p = 400, h2 = 0.5)
plot(reml_exact(dat$y, dat$G))