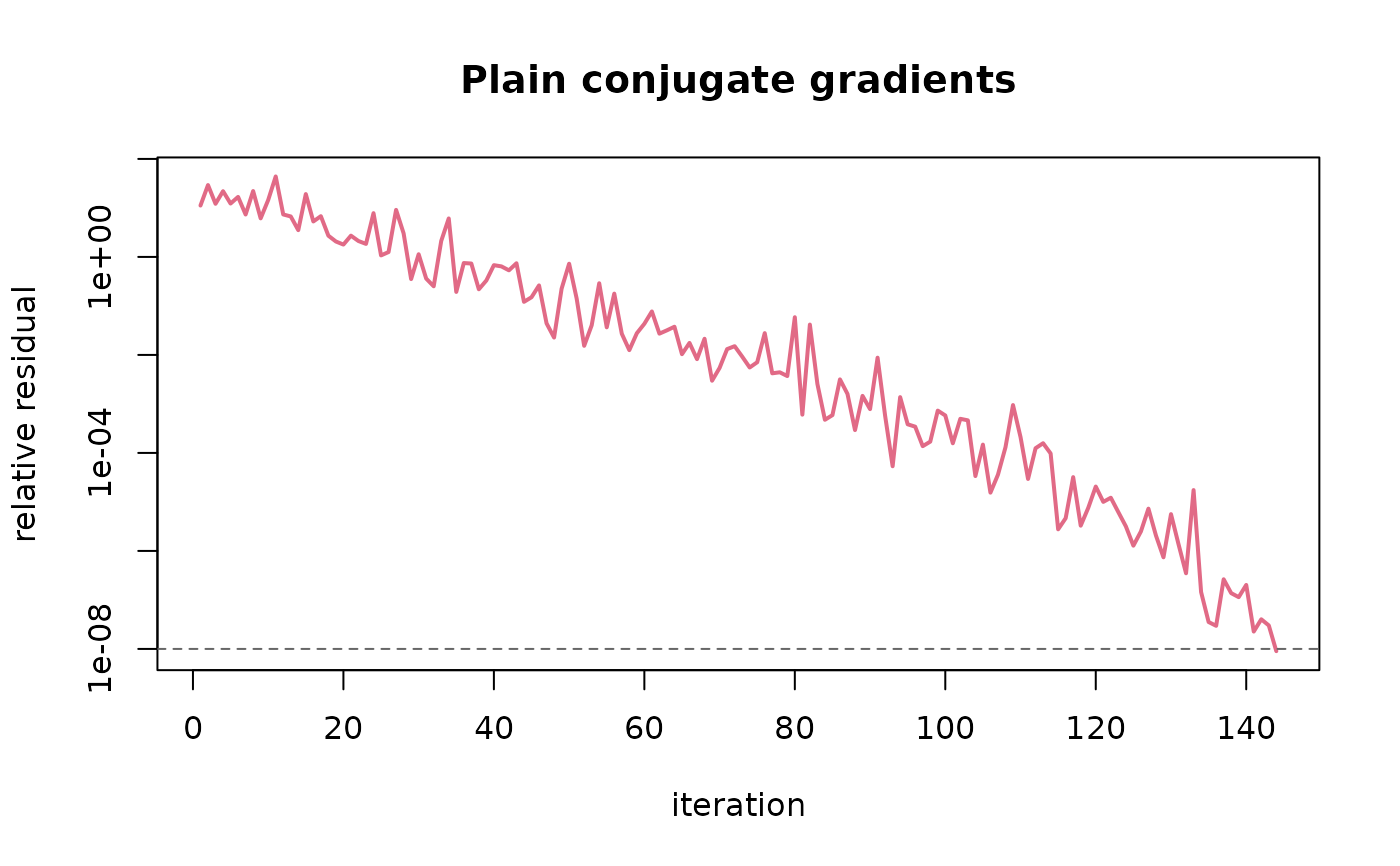
Draws the relative residual after each iteration on a logarithmic scale, one line per system solved.
Usage
# S3 method for class 'pcg_result'
plot(x, tol = NULL, ...)
Arguments
- x
An object from
pcg().- tol
Optional tolerance to mark with a horizontal line.
- ...
Passed to
graphics::matplot().