
Plots the top features from analyze_target() by association strength.
Examples
df <- data.frame(y = rnorm(50), a = rnorm(50), b = rnorm(50))
plot_target(df, "y")
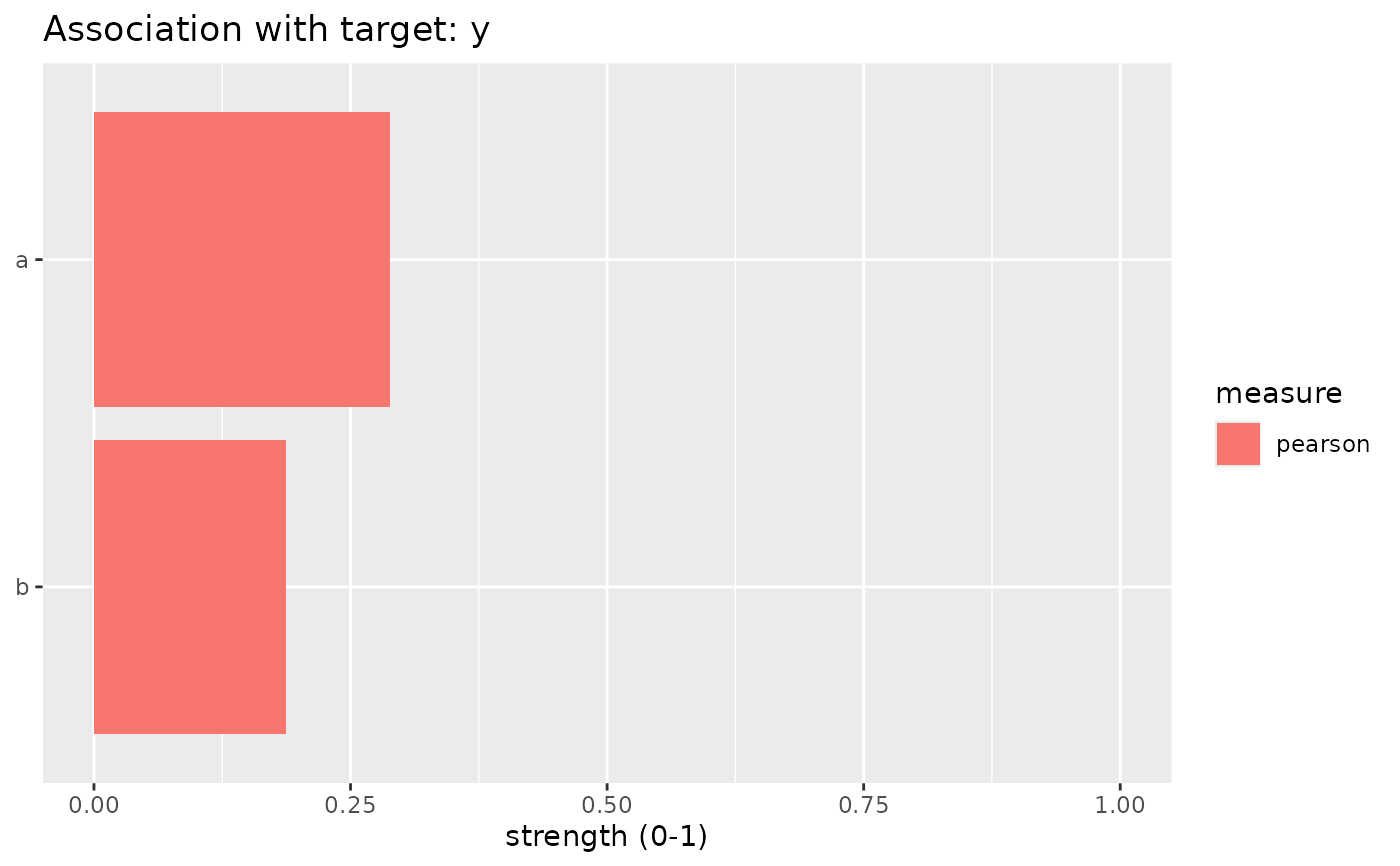
Plots the top features from analyze_target() by association strength.
df <- data.frame(y = rnorm(50), a = rnorm(50), b = rnorm(50))
plot_target(df, "y")