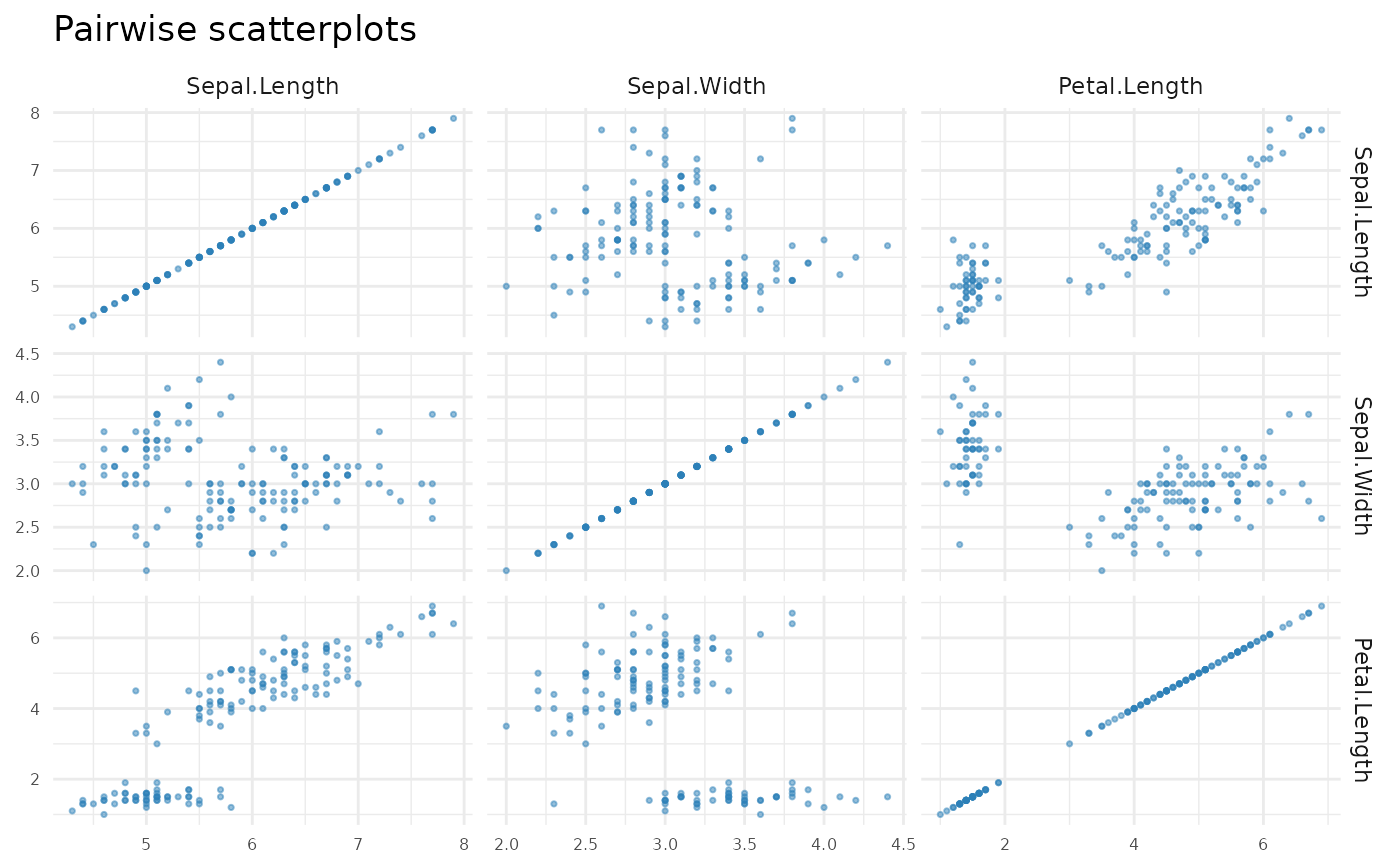
A scatterplot matrix over selected numeric columns, drawn with facets. Capped at a handful of columns because the number of panels grows quadratically.
Examples
plot_pairs(iris, c("Sepal.Length", "Sepal.Width", "Petal.Length"))
A scatterplot matrix over selected numeric columns, drawn with facets. Capped at a handful of columns because the number of panels grows quadratically.
plot_pairs(iris, c("Sepal.Length", "Sepal.Width", "Petal.Length"))