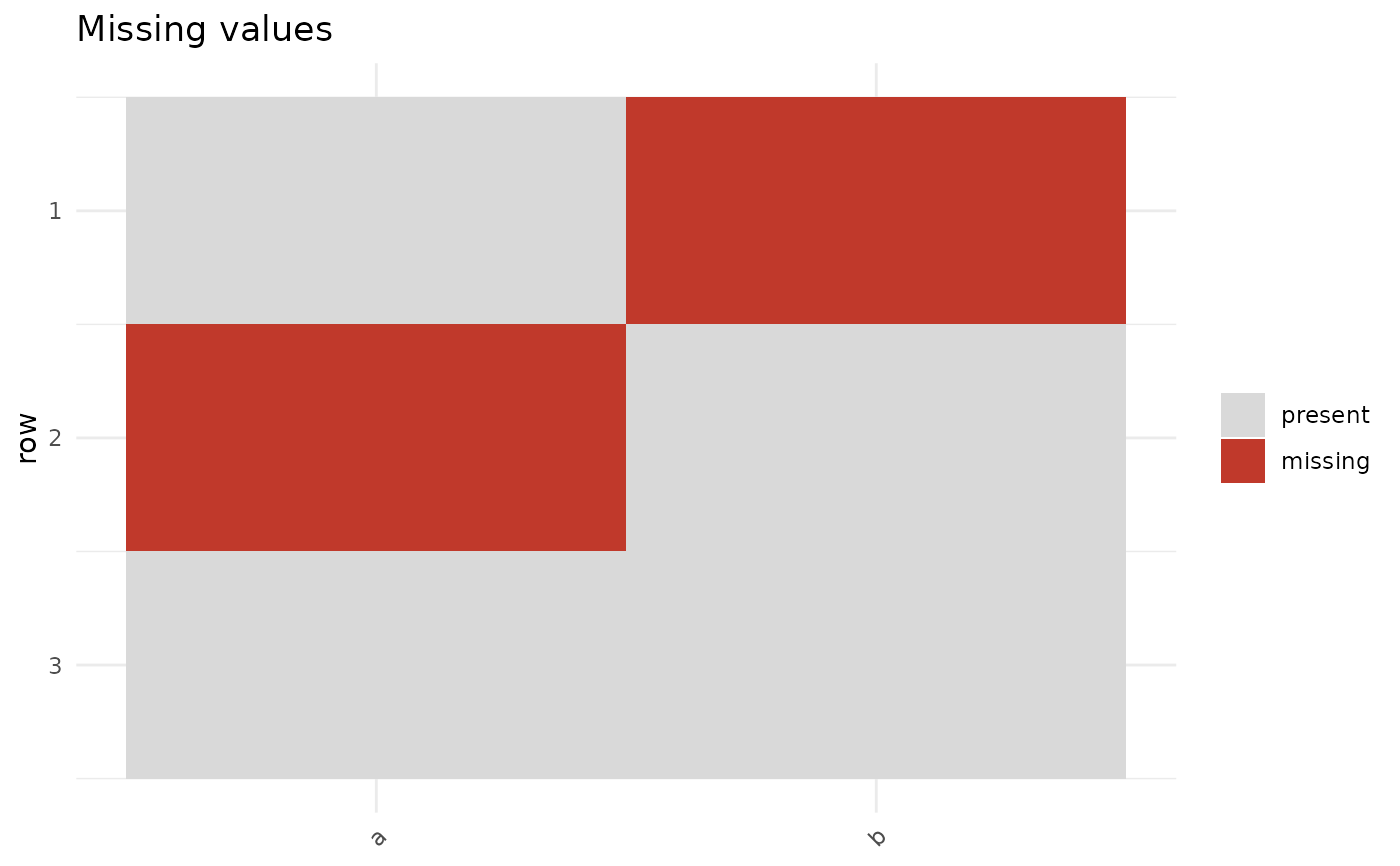
A tile plot of where NAs fall: columns on the x-axis, rows on the y-axis,
shaded by whether each cell is missing. For wide/tall data the rows are
subsampled to max_rows so the plot stays legible.
Examples
df <- data.frame(a = c(1, NA, 3), b = c(NA, "y", "z"))
plot_missing(df)