Skip to contents

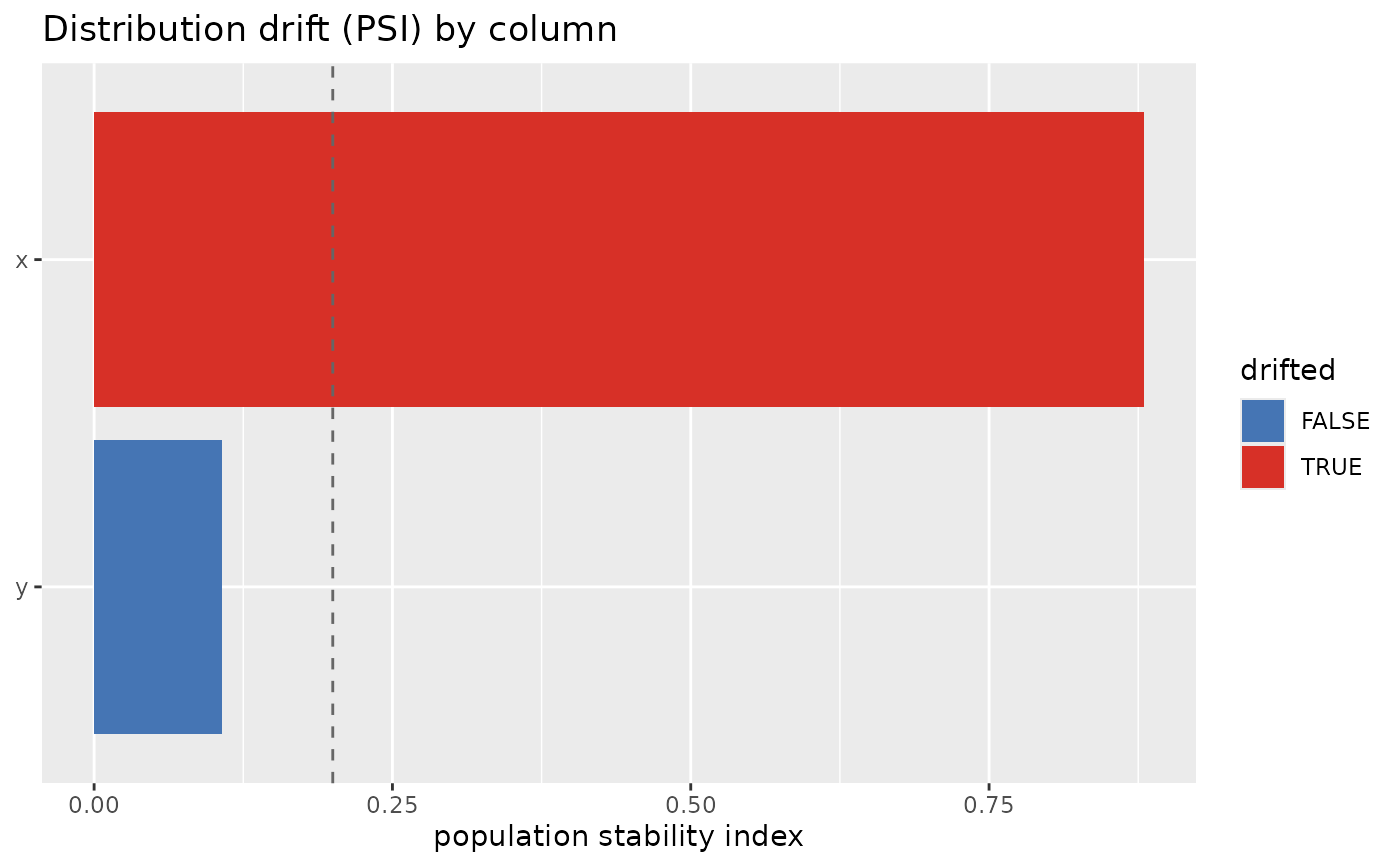
Plots the PSI of each column from compare_datasets(), highlighting columns that exceed the drift threshold.

Usage

plot_drift(reference, current, bins = 10, psi_threshold = 0.2)

Arguments

reference, current

Data frames to compare. Only columns present in both are used.

bins

Number of quantile bins for numeric PSI (default 10).

psi_threshold

PSI at or above which a column is flagged as drifted (default 0.2).

Value

A ggplot object.

Examples

set.seed(1)
ref <- data.frame(x = rnorm(200), y = rnorm(200))
cur <- data.frame(x = rnorm(200, 1), y = rnorm(200))
plot_drift(ref, cur)