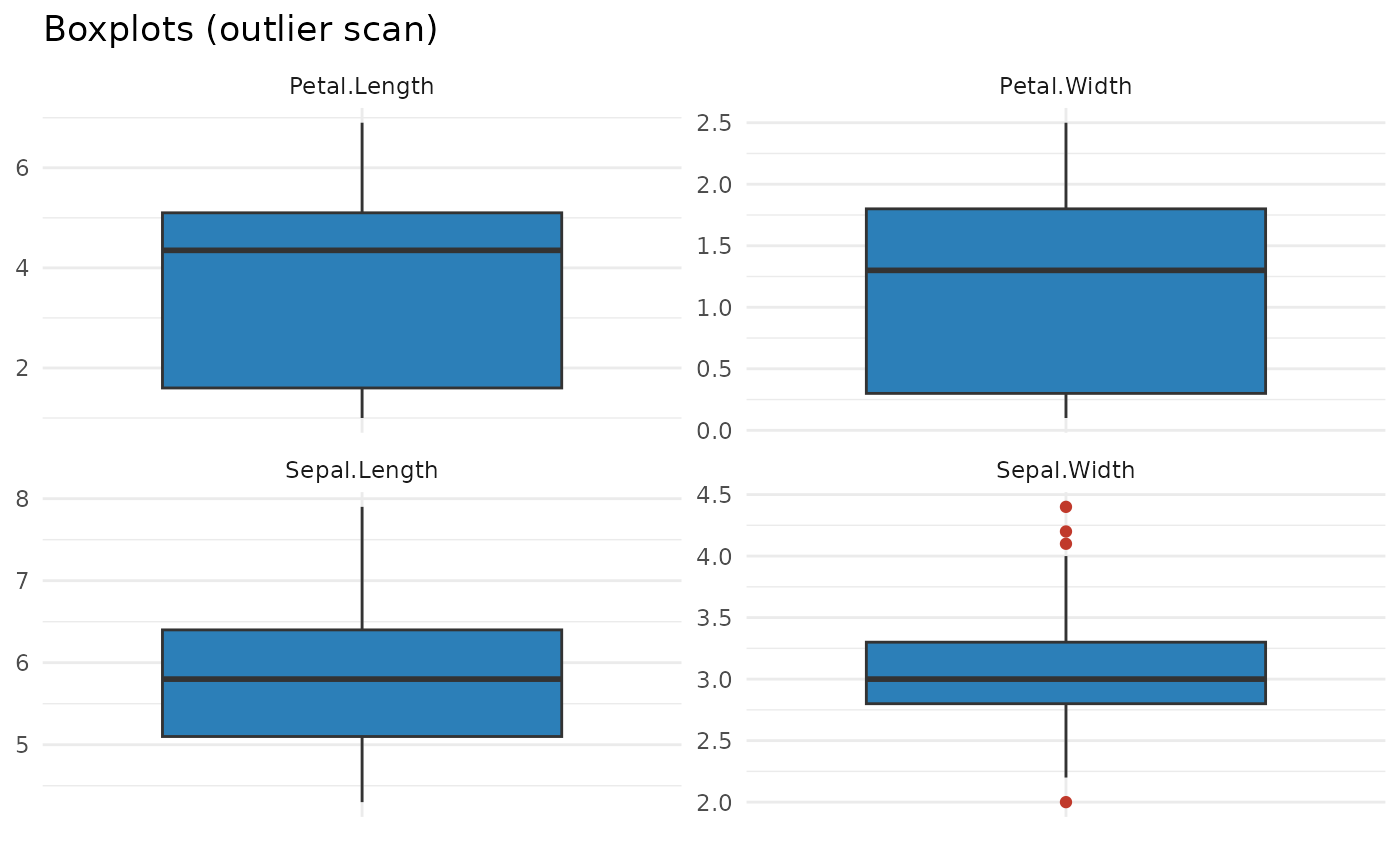
One boxplot per numeric column, faceted with free y-scales so columns on different scales are still readable. Useful as a quick outlier scan.
One boxplot per numeric column, faceted with free y-scales so columns on different scales are still readable. Useful as a quick outlier scan.