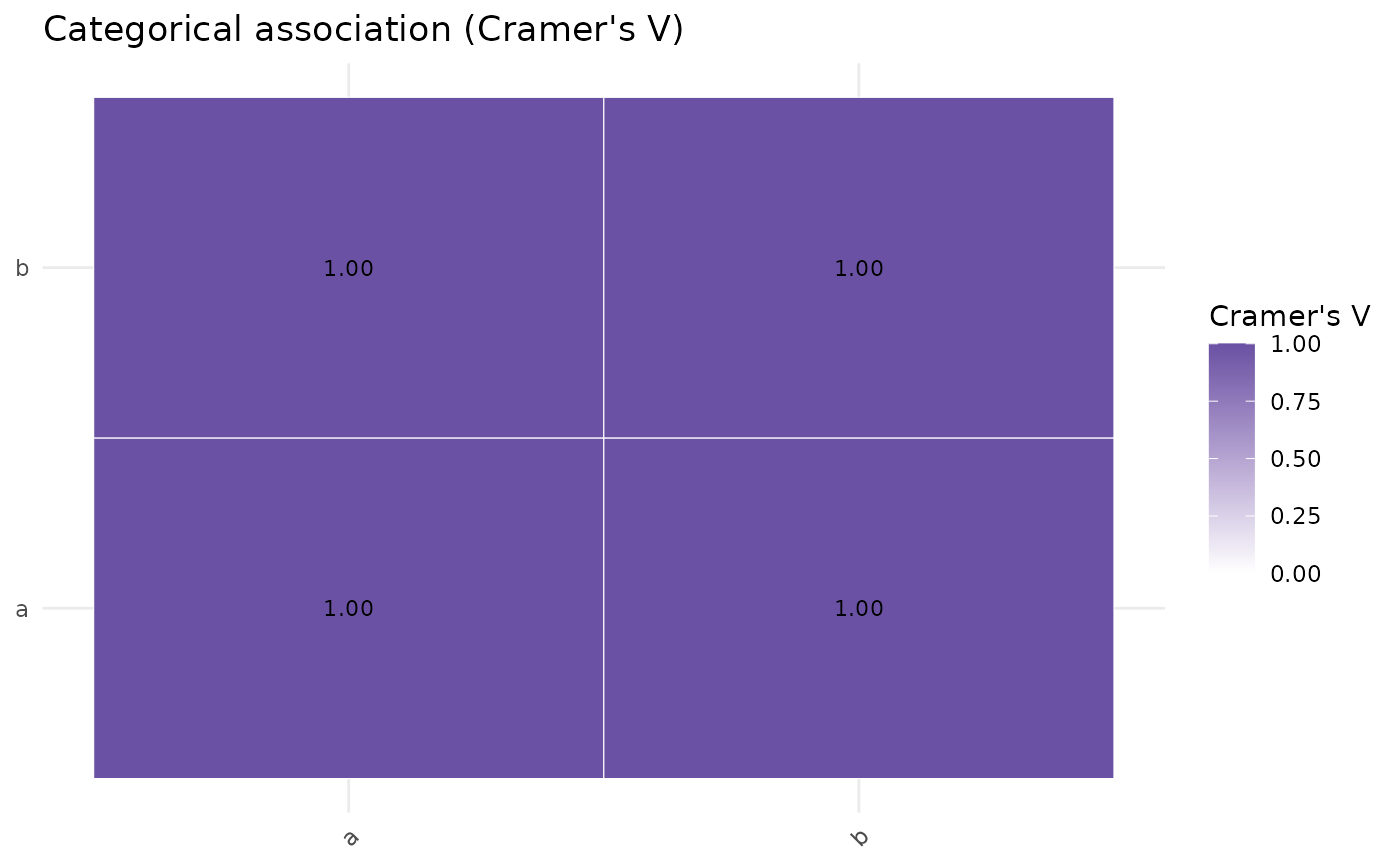
Heatmap of the Cramer's V matrix from categorical_association().
Arguments
- df
A data frame.
- max_levels
Passed to
categorical_association().
Value
A ggplot2 object, or NULL (with a warning) if there are fewer
than two eligible categorical columns.
Examples
plot_association(
  data.frame(a = c("x", "x", "y", "y"), b = c("p", "p", "q", "q"))
)