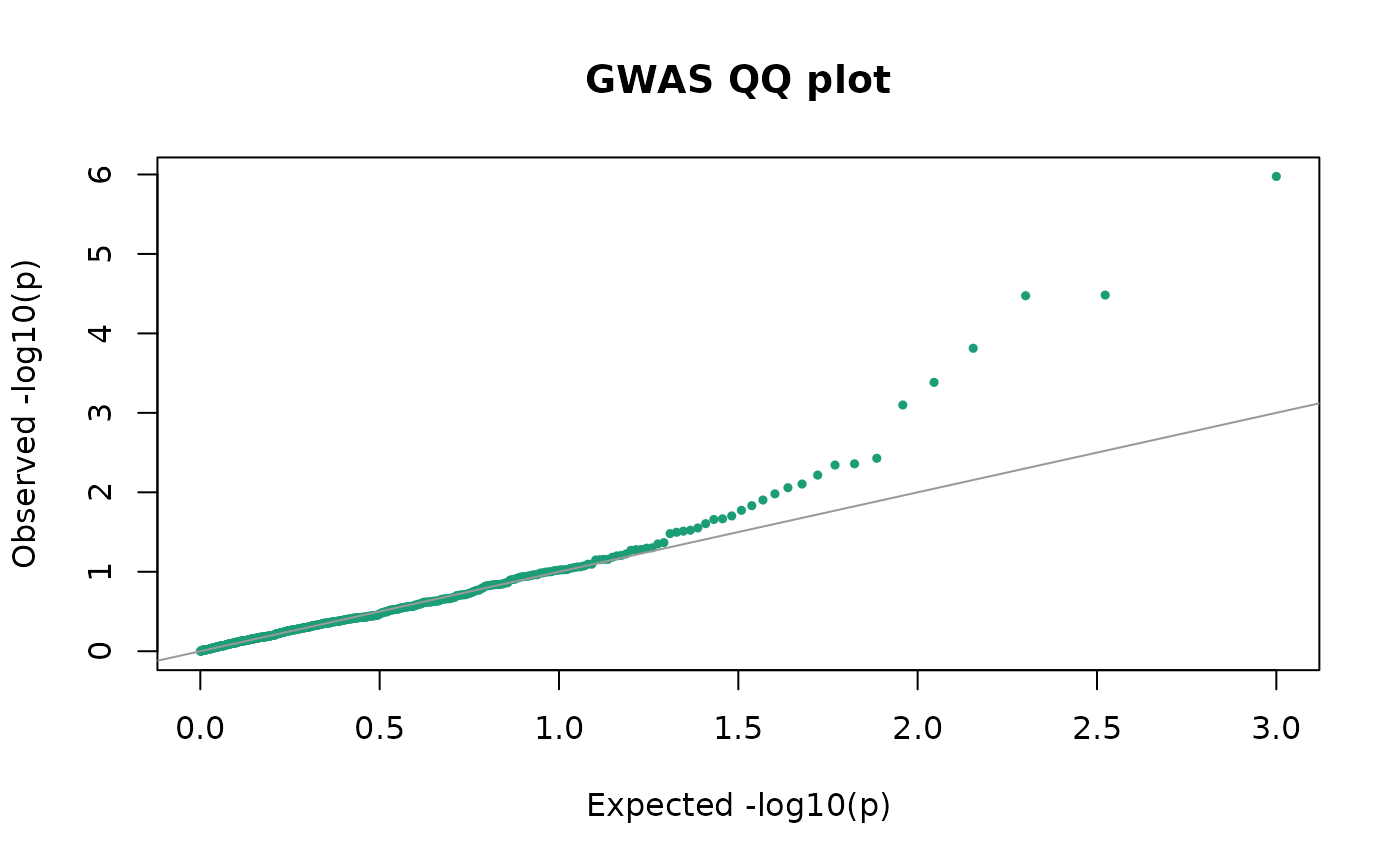
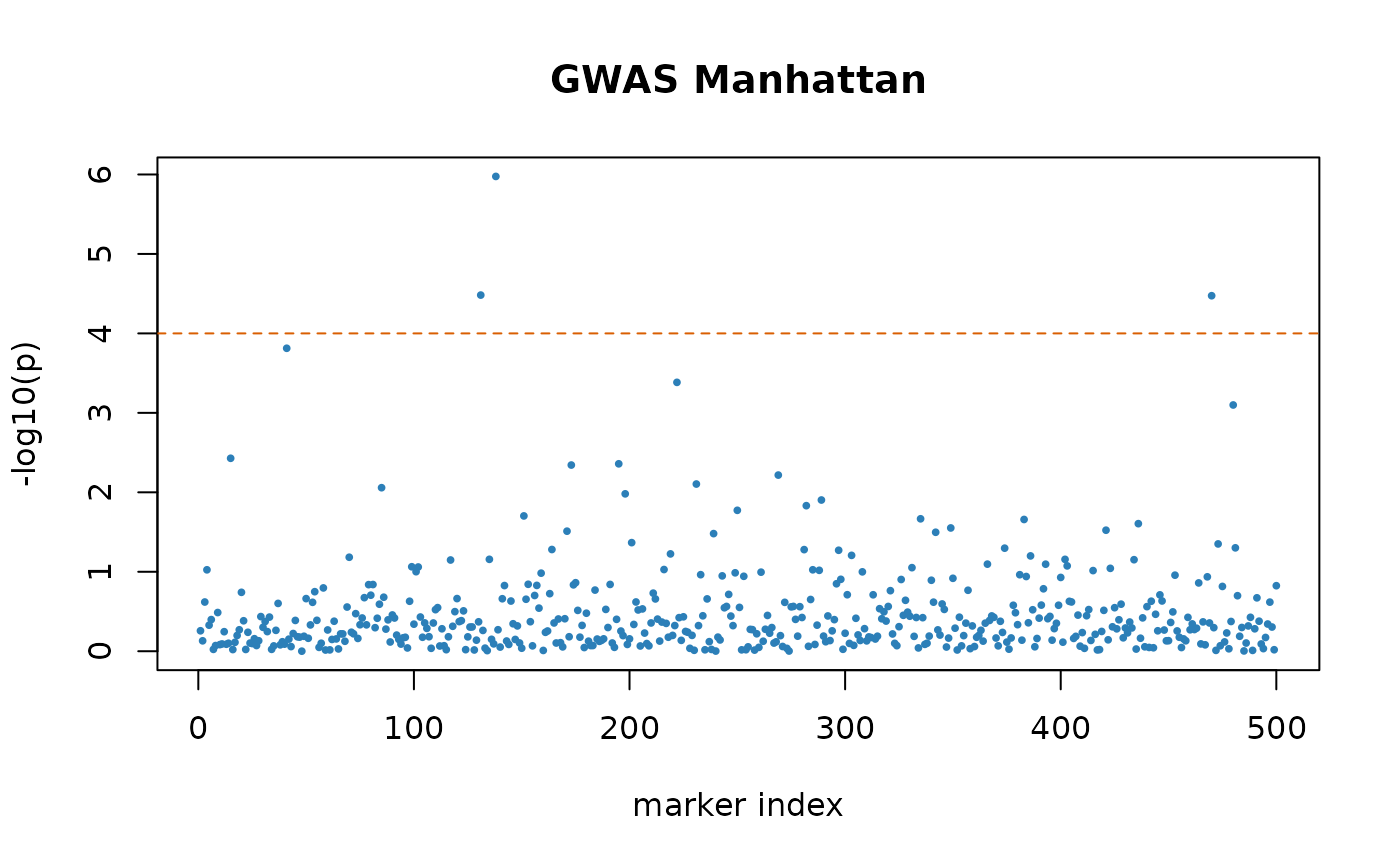
Plot a GWAS scan (Manhattan or QQ)
Arguments
- x
A
gs_gwasobject fromgwas().- type
"manhattan"(default) or"qq".- alpha
Genome-wide significance level for the Bonferroni line on the Manhattan plot (default 0.05).
- ...
Further graphical parameters passed to
graphics::plot().
Examples
sim <- simulate_population(n = 150, m = 500, n_qtl = 10, h2 = 0.6, seed = 1)
scan <- gwas(sim$pheno, sim$geno, n_pc = 3)
plot(scan)
 plot(scan, type = "qq")