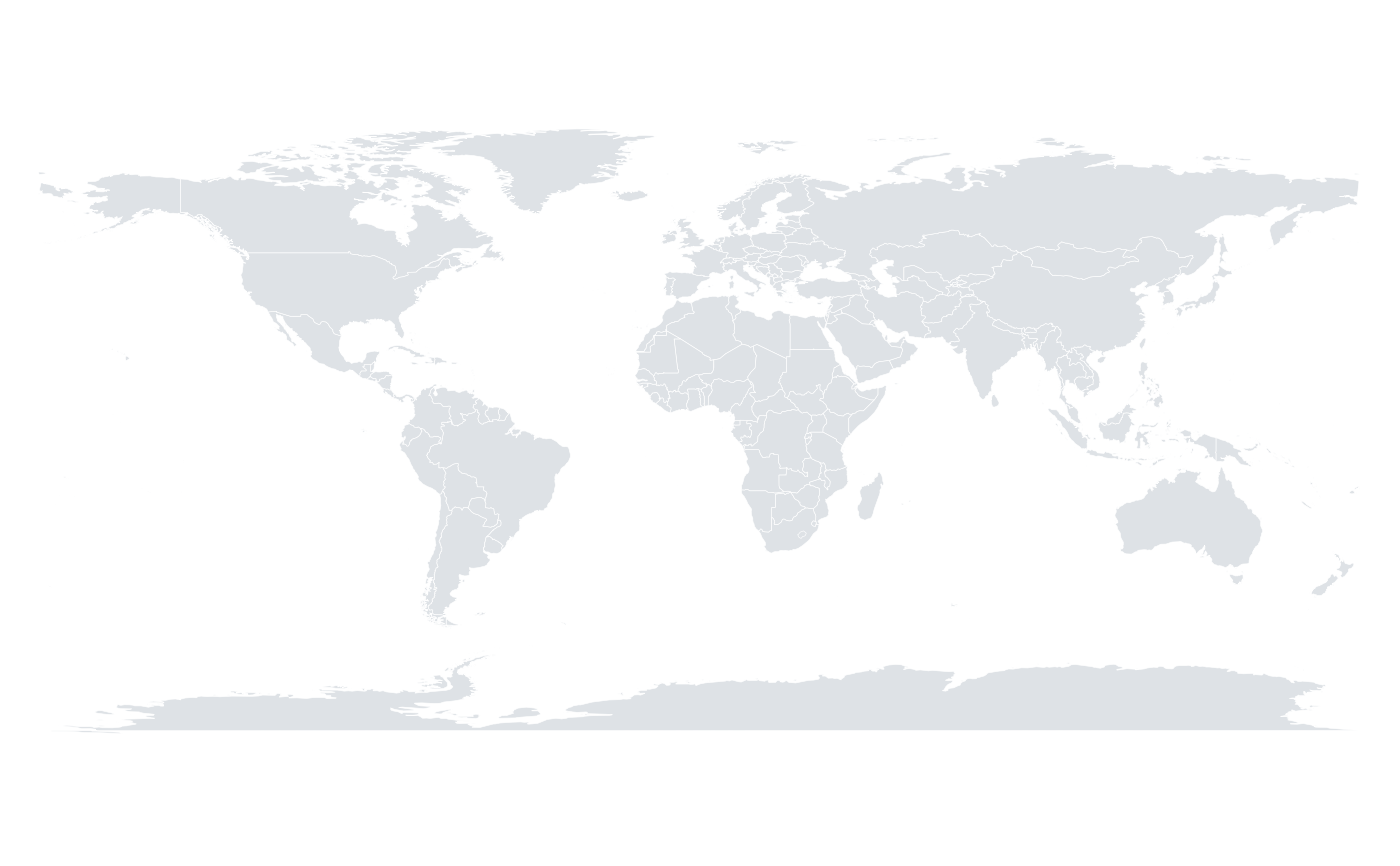
Draws country polygons from the built-in world_map dataset, or from a data
frame of your own with long, lat and group columns. The projection is
set with orb_coord_map(); if none is given, an equirectangular projection
is used.
Usage
orb_map(
  data = NULL,
  values = NULL,
  region_col = "region",
  value_col = NULL,
  fill = "#DEE2E6",
  colour = "#FFFFFF",
  width = 0.4,
  alpha = 1,
  palette = "viridis",
  na_fill = "#E9ECEF",
  ocean = NULL
)
Arguments
- data
Optional polygon data frame with columns
long,lat,groupand (optionally)region. Defaults to world_map.- values
Optional data frame giving one value per region, used to fill the polygons.
- region_col, value_col
Column names in
valuesholding the region name and the numeric value.- fill
Fixed fill colour used when
valuesis not supplied.- colour
Border colour.
- width
Border width in pixels.
- alpha
Opacity between 0 and 1.
- palette
Continuous palette used for the choropleth; see
orb_palettes().- na_fill
Fill colour for regions with no value.
- ocean
Optional colour for the sea drawn behind the land: a disc for the orthographic globe, the panel background otherwise.
Details
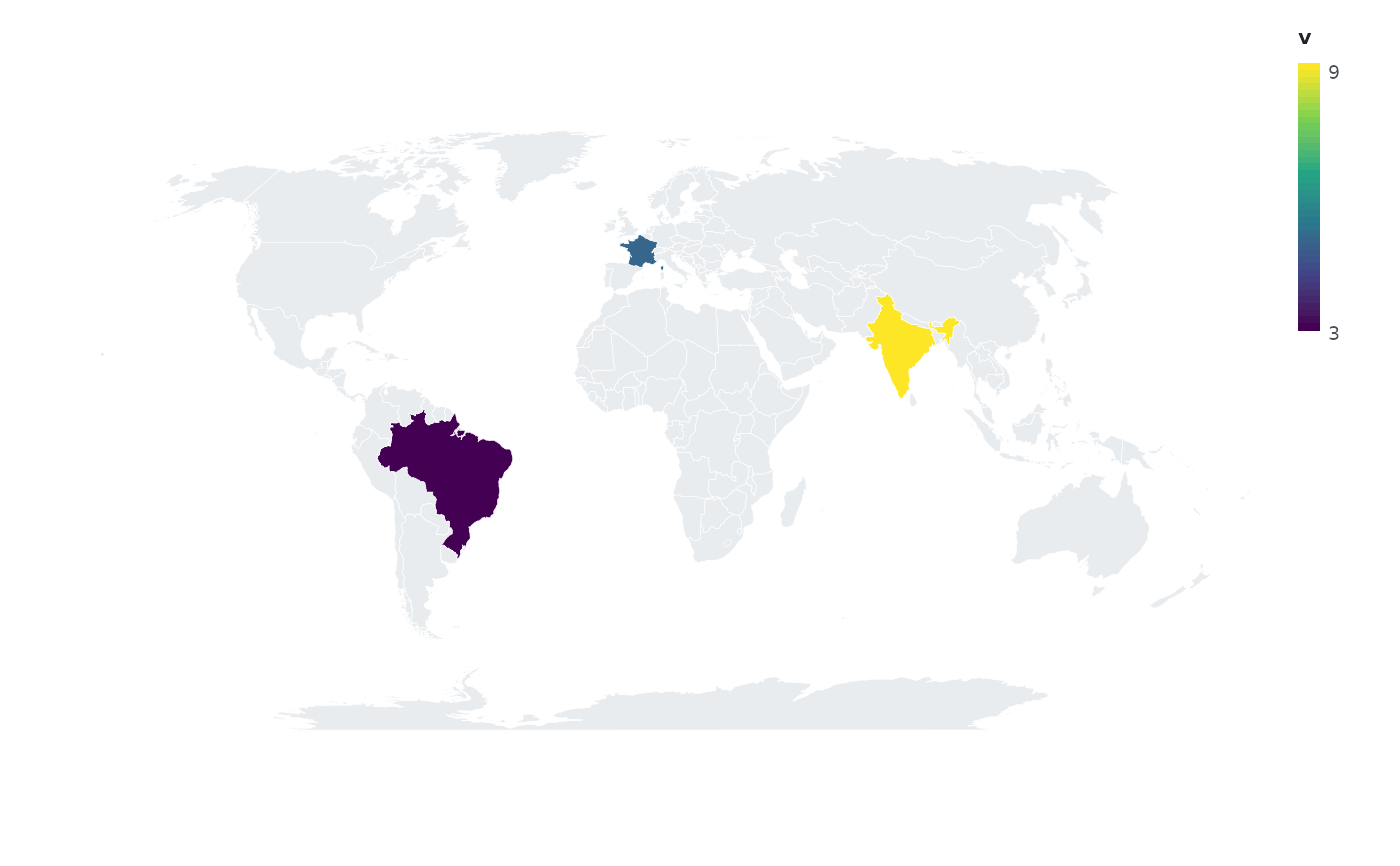
To build a choropleth, supply values: a data frame with a region column
and a value column, matched to map regions by name.
Examples
orb_worldmap()
#> <orb_spec>
#> data: 26953 rows x 4 columns
#> mapping:
#> layers: map
 vals <- data.frame(region = c("Brazil", "India", "France"), v = c(3, 9, 5))
orb(world_map) + orb_map(values = vals, region_col = "region",
value_col = "v") + orb_coord_map("robinson")
#> <orb_spec>
#> data: 26953 rows x 4 columns
#> mapping:
#> layers: map
vals <- data.frame(region = c("Brazil", "India", "France"), v = c(3, 9, 5))
orb(world_map) + orb_map(values = vals, region_col = "region",
value_col = "v") + orb_coord_map("robinson")
#> <orb_spec>
#> data: 26953 rows x 4 columns
#> mapping:
#> layers: map